Growth Hacking for New Businesses
Reads 5.7K
12 Mar. 2020 - Antoine Sané - Total Reads 5,808

As a content marketer, you know that “how’s our content performing?” never has a single or simple answer—especially in terms of sales.
Why? Because it’s unlikely for a first-time visitor to land on your website and hit the “purchase” button. If they do, they likely came to your website with much higher intent and one piece of content was unlikely to sway them in one way or the other.
This is why marketing teams have long created sales funnels; we need to establish trust with the reader, establish ourselves as an authority, help educate them on problems that they need to solve, etc., before they’re likely to become a customer.
Okay, so, then there must be some way to measure the effectiveness of our content marketing efforts besides sales then, right?
Otherwise, how can we possibly report that the work we’re doing is correlated to organizational success?
We’ve shortlisted the following lead generation metrics as a way to report on the success of your content marketing efforts without depending exclusively on sales figures.
Let’s start with the obvious one. One of the simplest ways to determine the impact content is having on your bottom line is to monitor how many new people are opting into your email list.
The bigger the list your content efforts secures, the more opportunity your marketing and sales efforts will have further down the road to further engage these people and get them closer to a sale.
As Jonathan Aufray of Growth Hackers explains: “Once your visitors have given their email addresses, you know that they’re interested in what you do and become leads.”
You can track this data by creating a Google Analytics goal that triggers when somebody submits a response to your opt-in form:
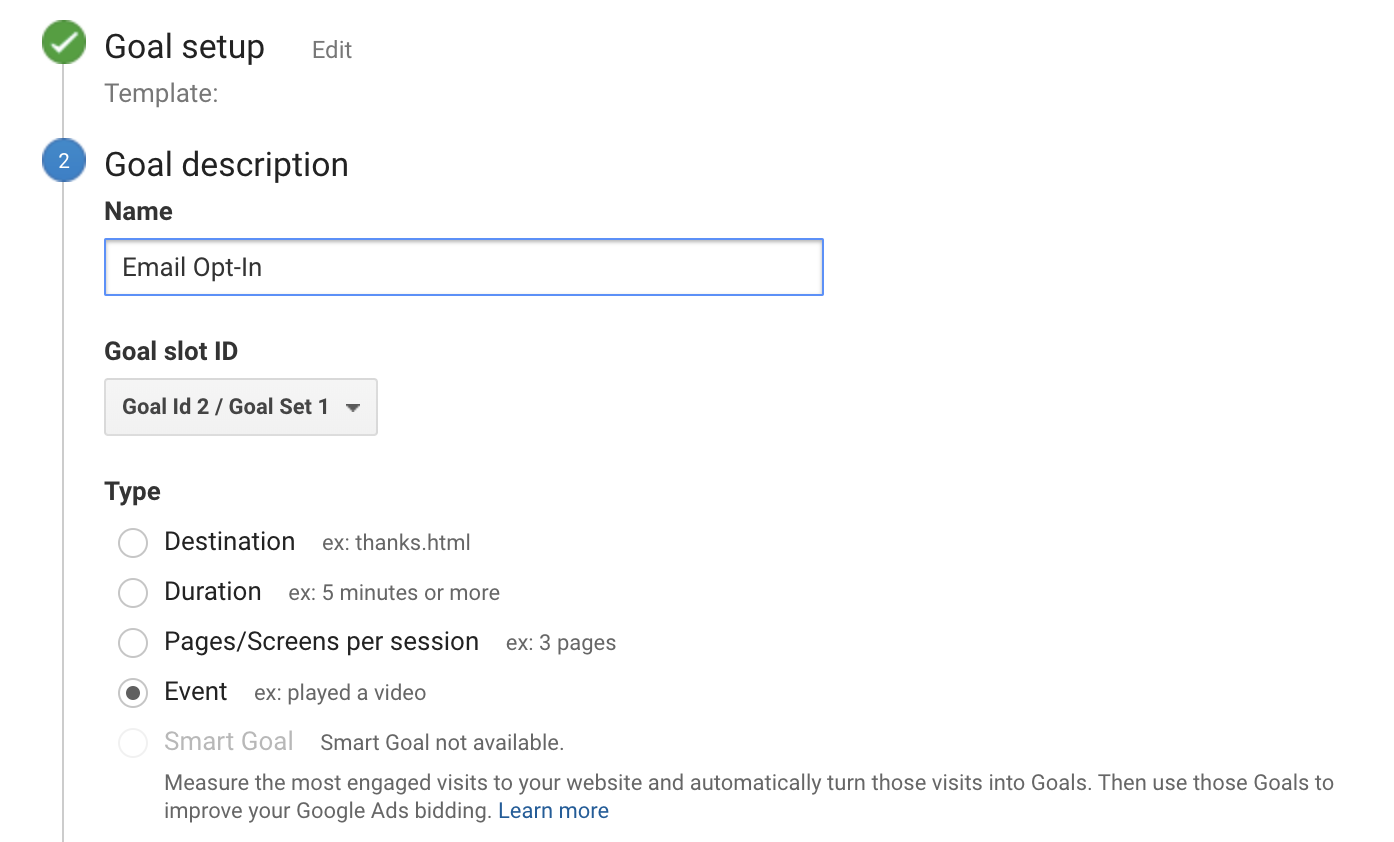
Keep tabs on your opt-in rate for each individual piece of content that you publish. That way, you can spot whether certain topics or formats attract the most subscribers and replicate the approach again to attract more.
Another great way to communicate the value of your content marketing efforts is to report on the number of new visitors your content is driving to the website.
As content scales (more email subscribers, most followers, more customers, etc.) traffic tends to trend upward. However, if you want to report that your content is truly scaling and not simply a product of a growing customer and email base, you’ll want to report on the percentage of new people your content continues to drive to the website.
You can find this in Google Analytics by navigating to Behavior>Site Content>Landing Pages. Here, you’ll see a column for ‘% new sessions’.
In the table visualization that accompanies this, you’ll be able to track and/or segment the pages on your website that are driving the most/least new visitors to your website.
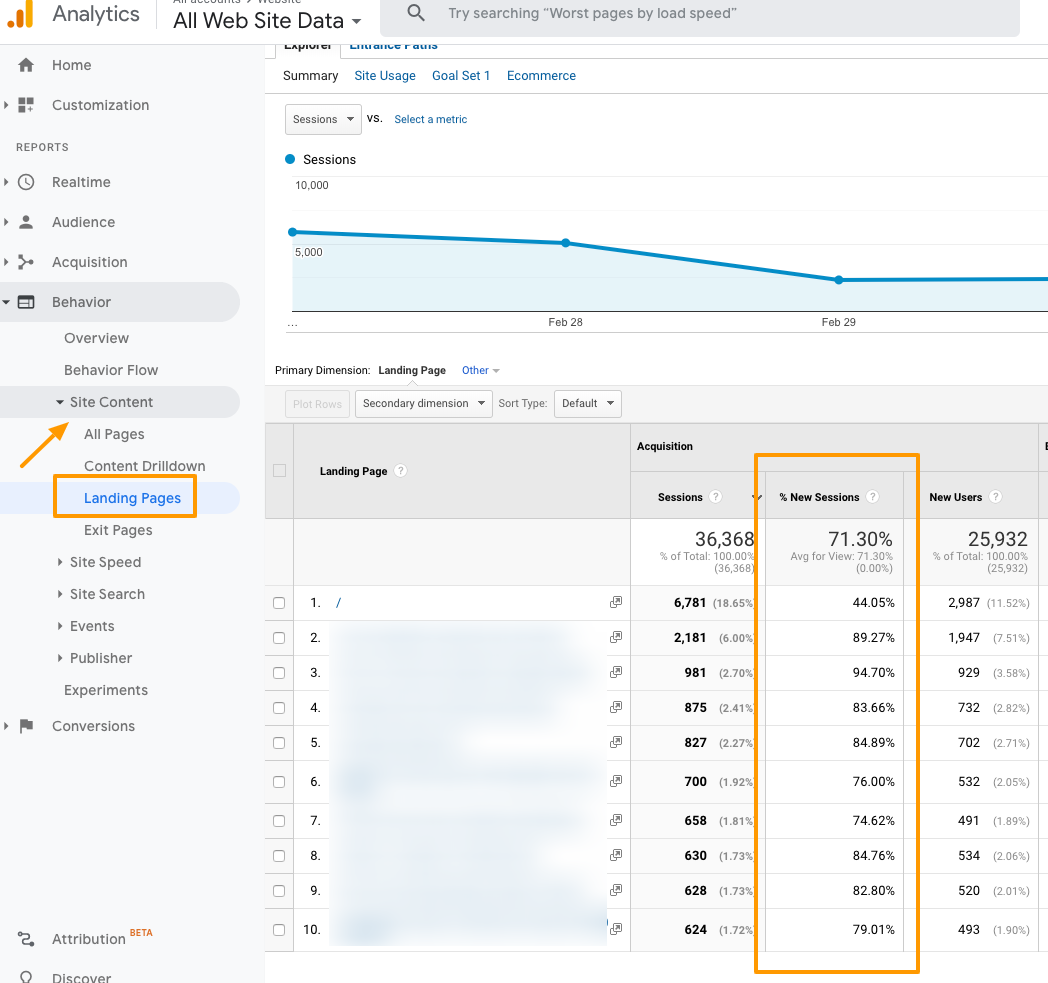
If your content marketing efforts are driving a high percentage of new sessions to your website, this is a great indicator of the value and overall effectiveness of the approach and is a good signal that your continued efforts can scale.
Sales needs leads. You can’t continue growing leads without (new) visitors to the website.
This metric is building off the previous point in #2 about ‘% of new sessions.’
‘New users’ is a metric that gets you closer to measuring the number of new unique visitors to your website or a specific piece of content.
So, why should you measure both? What’s the difference between Sessions and Users?
‘% new sessions’ will convey how effective your content marketing efforts are at driving new visitors in relation to the total amount of website traffic you’re generating in a given month.
For example, 100,000 sessions sounds a lot less impressive (from a growth perspective) if the % new sessions is only 5%.
Now, if that number is 55%? Now you know your content efforts are scaling.
Where new users are helpful is in determining the number of unique session IDs associated with all of those new sessions. Session IDs are unique to each person (although they do expire and one person can have multiple IDs if they’re viewing your content on multiple devices), so, they’re a closer representation for the amount of new, unique people you’re driving to the website. (Although it’s not 100% air right.)
So, in summary…
Again, both metrics are great indicators that your content efforts are attracting new people to your website and can support your lead and sales goals as you continue to scale the efforts.
When we talk about conversion rates, it’s not just the visitor-to-customer conversion rate we should be thinking of.
You should also track how many of your marketing-qualified leads turn into sales-qualified leads, as Kevin D’Arcy of ThinkFuel Marketing explains: “The reason we do this is to validate that our content is attracting and converting the right type of visitors and prospects.’
“Traffic is great, marketing qualified leads are great too, but if they don’t transition into SQLs then they weren’t the right type of people.”
According to Salesforce, the average MQL to SQL conversion rate is 13%. Use this as a benchmark for getting started in tracking yours.
One solid way for improving yours is to ask SQLs (via email, phone, survey, etc.) how they found you to begin with. Are there any common themes with the content that’s resonating with this group? How can you get more of this type of content in front of your MQLs and prospects that may be even further up the funnel?
Doubling down on what’s already working is always a sound strategy for finding ways to improve.
“If you don’t know where people go from the content, you don’t know how well it’s performing, how well it’s guiding visitors deeper, how well it’s getting visitors closer to the conversion,” says Andy Crestodina of Orbit Media.
“Are they leaving immediately? Are they going somewhere irrelevant? Are they clicking on the calls to action?”
Find the answers to Crestodina’s questions by looking at your navigation summary in Google Analytics—the URLs people visit before and after the page they’re currently on.
For example: You might find that 60% of people head to your pricing page after viewing a blog post, but just 10% do so from a video. This gives a stronger indication that blog readers are further along in the sales journey and more inclined to buy.
Therefore, you’d certainly want to include a metric like this in any content marketing reporting in order to illustrate how many people your content is sending over to the pricing page and/or other high-intent pages like this (free trial signups, consults, etc.)
To find the navigation summary in Google Analytics, navigate to Behavior>Site Content>All Pages..

…then, click “Navigation summary”…
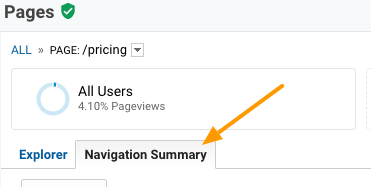
..and lastly, select the pages that you’d like to drill into. For example, in the screenshot below, we’re measuring the previous page path of a pricing page, meaning the list of pages (in a table format) that are most often driving people to the pricing page.
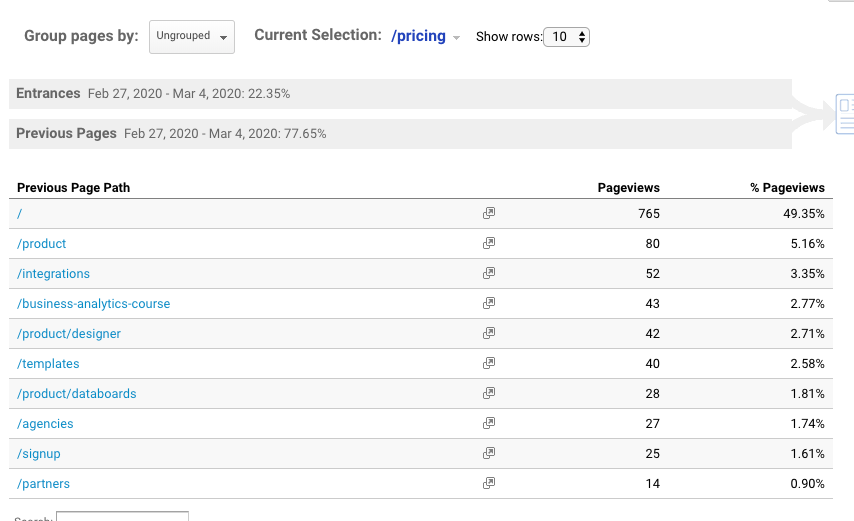
Now, you can more easily communicate the value of specific pieces of content based on the number of people they’re driving to the high-intent pages on your website.
Never sweat when asked how well your content marketing is performing. The ROI isn’t always judged in direct sales; you can use these metrics to understand the impact your content is making. As Eric Melillo of COFORGE says, “with content marketing being the lifeblood of today’s marketing strategy, it’s really important to monitor the effectiveness of each piece of content we create.”
Credit: Elise from Databox team
For more articles click here
Go on, see if you can challenge us on "What’s the Best Way to Track the ROI of Content Marketing…Besides Sales?" - Part of our 168 services at AndMine. We are quick to respond but if you want to go direct, test us during office hours.
Add Your CommentJust a quick note to say a big thanks and well done for doing what you said you would - building us a world class Health Food web site. It looks great! We will find a way to properly thank your team for their hard work and terrific results. Russell, CEO, Melrose Health
More Testimonials